
Insights & Updates
How to Improve Bottling Line OEE: Find the Hidden Speed Losses
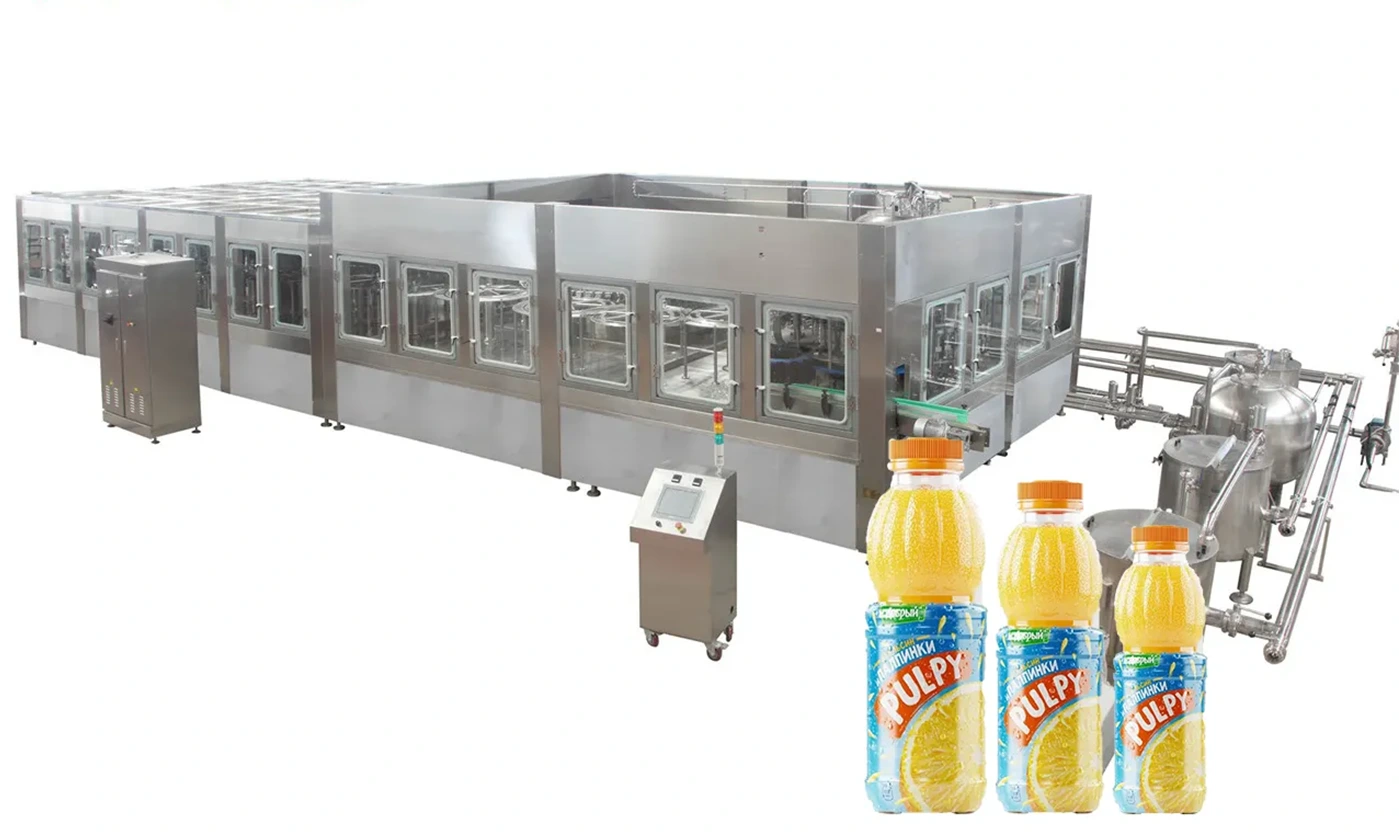
Many beverage plants respond to missed production targets by increasing the set speed of the filling machine. The result is often more fallen bottles, labeler stops, cap-feed alarms and shrink-wrapper queues—not more saleable cases. The real problem is that nameplate speed is only one part of line performance. What matters is how much good product leaves the line during the time the line was expected to run.
Overall equipment effectiveness (OEE) gives managers a practical way to separate lost time into availability, performance and quality. Used correctly, it shows whether the next improvement should be maintenance, operator training, conveyor accumulation, changeover work or a capacity upgrade.
Quick answer: Measure OEE at the finished-pack discharge, record every stop by cause and duration, and compare actual output with a realistic ideal rate for the active SKU. Focus first on the few losses that consume the most minutes or repeatedly reduce speed. A balanced line operating steadily at a slightly lower speed often produces more good bottles per shift than a filler that repeatedly accelerates and stops.
Start with the Three OEE Factors
OEE is calculated as Availability × Performance × Quality. Availability measures how much of the planned production time the line actually ran. Performance compares actual output with the output that should have been possible while running. Quality is the share of output that was saleable without rework. For example, 90% availability, 92% performance and 99% quality produce an OEE of about 82%. Each factor points to a different family of losses.
| Factor | Typical bottling-line losses | Useful evidence |
|---|---|---|
| Availability | Breakdowns, long sanitation, missing materials, changeovers | Stop log and maintenance records |
| Performance | Micro-stops, reduced filler speed, blocked conveyors | Actual bottles per minute by hour |
| Quality | Low fill, loose caps, label defects, damaged packs | Reject counts by defect type |
Do not calculate OEE from the filler alone if the business sells finished cases. The measurement point should normally be after secondary packaging. This prevents a fast filler from looking successful while unlabeled bottles or unpacked cases accumulate downstream.
Use a Realistic Ideal Rate for Each SKU
A common mistake is using the highest speed shown in a brochure for every bottle format. Actual ideal rate depends on bottle diameter and stability, fill volume, liquid foaming, cap type, label material, pack pattern and the slowest machine in the line. A 500 ml water bottle and a 1.5 L lightweight bottle may run on the same equipment but should not share the same standard rate.
Create an approved ideal cycle rate for every important SKU after a stable production trial. The target should be demanding but repeatable, not a one-minute peak. If the line has not yet been selected, ask the supplier to model the complete line around the SKU mix rather than quoting only the automatic beverage filling machine.
Capture Micro-Stops, Not Only Major Breakdowns
Ten stops of thirty seconds can disappear from a handwritten shift report, yet repeated every hour they become a major loss. Typical micro-stops include bottles tipping at transfers, caps bridging in the chute, labels failing to separate, film tracking corrections and packs waiting at a conveyor merge. They reduce performance even when maintenance records show no breakdown.
- Use a simple cause code for every stop longer than a chosen threshold, such as ten seconds.
- Record the machine that first caused the stop, not the equipment that displayed the final alarm.
- Separate starvation, internal machine faults and downstream blocking.
- Review frequency as well as total minutes; a frequent short stop often has a simple mechanical cause.
Check Whether the Line Is Starved or Blocked
The filler may stop because it has no bottles, caps or product, which is starvation. It may also stop because downstream machines cannot accept more bottles, which is blocking. These conditions require different corrections. Starvation may point to blow-molder output, air-conveyor settings, cap feeding or beverage preparation. Blocking may point to labeling, inspection, packing, palletizing or insufficient accumulation.
Observe the line during a representative hour and mark where containers accumulate. Well-designed buffer conveyors absorb short disturbances without allowing pressure to damage bottles or labels. HZM offers complete beverage filling line integration, which makes it possible to size the interfaces together instead of treating each machine as an isolated purchase.
Prioritize Losses with a Pareto Review
At the end of each week, sort loss minutes from largest to smallest. The top three causes usually deserve immediate action. A useful corrective-action record states the loss, evidence, suspected mechanism, owner, due date and verification result. Avoid broad actions such as “operators should be more careful.” A stronger action is “install a guide at the cap-elevator discharge and verify fewer than two cap-feed stops per shift.”
Track the result for several production runs. If a change merely moves the queue to another machine, the line constraint has shifted rather than disappeared. Continue the review until finished-case output improves.
Improve Stability Before Raising Speed
Run the line at the fastest rate that remains stable for the full observation period. First correct bottle handling, guides, sensor positions, cap delivery, filling conditions and packer timing. Then increase speed in small controlled steps. Operators should know the approved center settings for each SKU so that a good setup is reproducible across shifts.
This approach protects quality as well as output. Excessive acceleration can increase fill variation, foam, label skew and package damage. The best result is not the highest machine display; it is the largest number of conforming cases shipped per labor hour.
A 30-Day OEE Improvement Plan
- Week 1: define planned time, ideal rates, reject categories and stop codes.
- Week 2: collect data without changing too many variables; verify that shift teams classify stops consistently.
- Week 3: fix the two largest recurring losses and standardize the new settings.
- Week 4: compare OEE, finished-case output and quality against the baseline, then choose the next constraint.
A small number of reliable measures is more valuable than a complex dashboard that operators do not trust. OEE should support daily decisions, not become a score used to hide planned downtime or quality loss.
Frequently Asked Questions
What is a good OEE for a beverage bottling line?
There is no universal number because product mix, changeover frequency and plant maturity differ. A stable upward trend with correctly defined inputs is more useful than comparing an unreliable figure with a generic benchmark.
Should changeover time be included in OEE?
Include it when the changeover occurs inside planned production time. If management deliberately excludes a planned period, document the rule and keep it consistent so improvements are not created by changing the calculation.
Can a new filler solve low OEE?
Only when the filler is the verified constraint or its condition causes recurring downtime and defects. If the line is usually blocked by labeling or packing, a faster filler may increase stops instead of saleable output.
Plan the Next Step with HZM Machinery
Share your bottle sizes, beverage type, target output, pack format and current loss data with HZM. The engineering team can review the constraint and propose a balanced equipment configuration rather than an isolated speed upgrade. Start with the water and beverage production line portfolio or request a project-specific layout.
Talk to our engineering team
Need help planning your packaging line?
Share your product, bottle and capacity requirements for a practical equipment recommendation.
2026-08-06
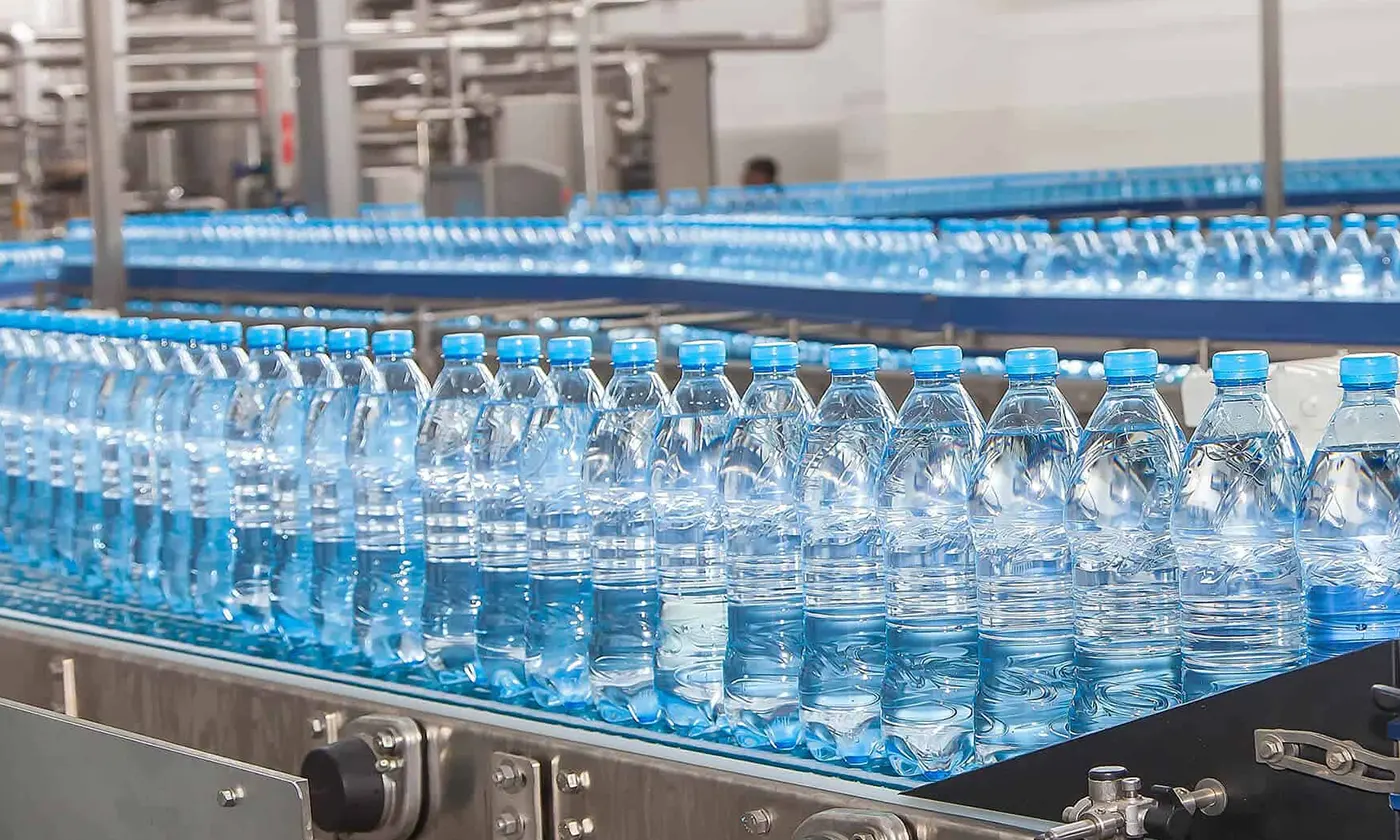
Bottle Conveyor Accumulation and Line Balancing: A Practical Guide
Size and control bottle conveyors to absorb short stops, prevent excessive pressure and protect overall filling-line efficiency.
Learn more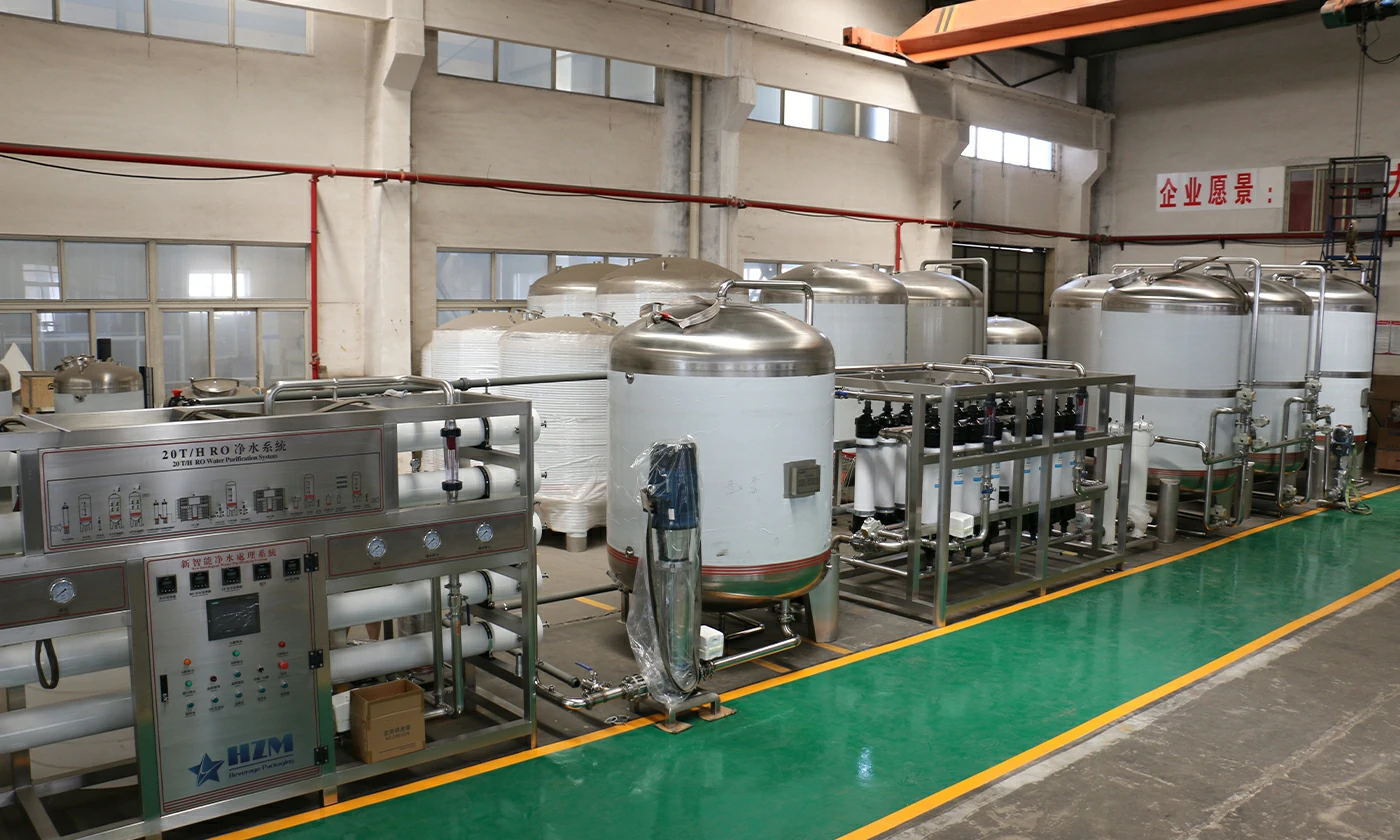
2026-08-12
FAT and SAT Checklist for a Turnkey Beverage Filling Line
Define factory and site acceptance tests for speed, quality, changeover, utilities, documents, safety, training and final line performance.
Learn more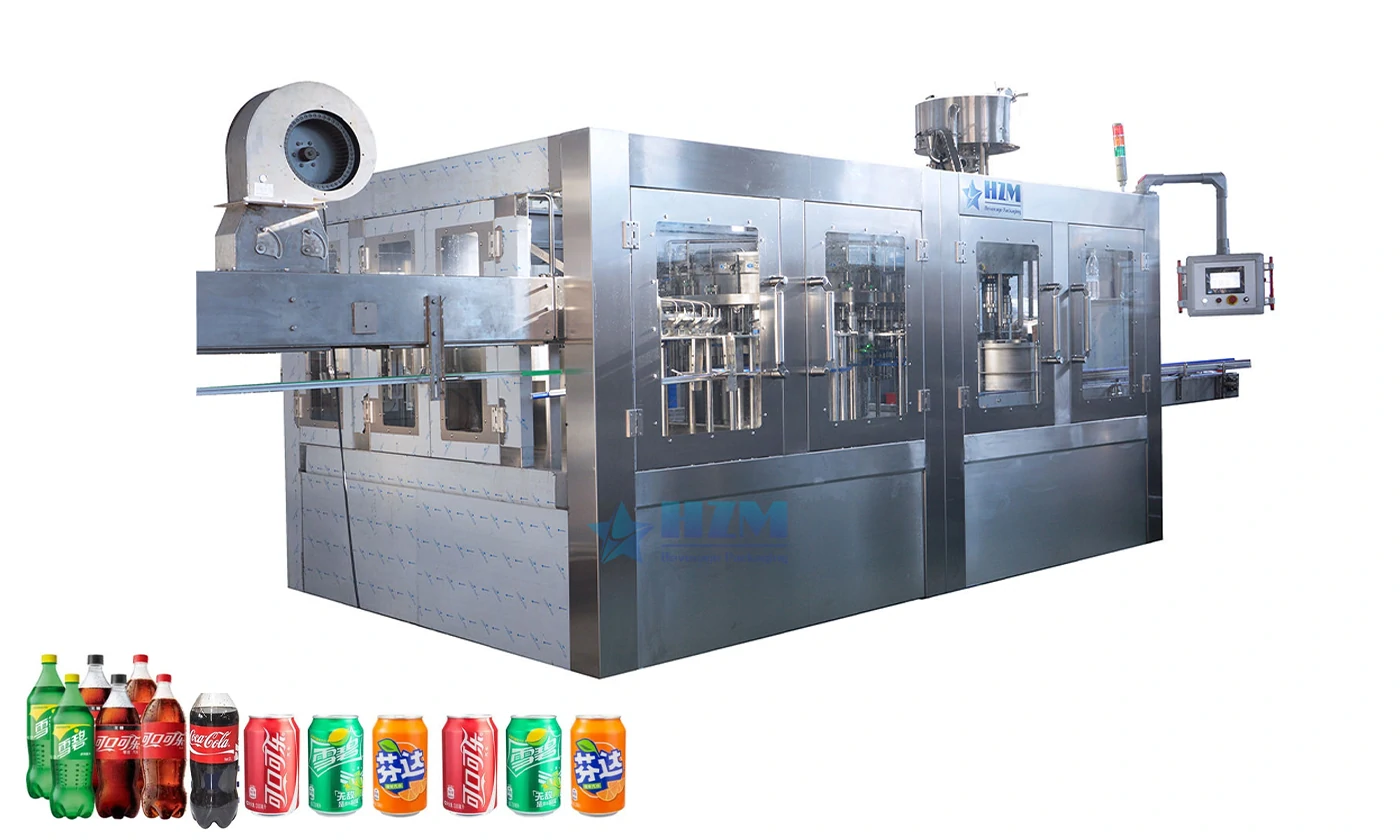
2026-08-05
Shrink Pack or Carton? How to Choose Secondary Packaging for Beverages
Compare shrink film, tray-and-film and cartons by product protection, material cost, retail needs, transport, automation and sustainability.
Learn more
2026-08-10
Beverage Plant Utilities Checklist Before Equipment Installation
Prepare electricity, compressed air, water, steam, cooling, drains, floor loads, ventilation and access before a beverage line arrives.
Learn more
2026-07-26
How to Calculate the Right Filling Machine Capacity for Your SKU Mix
Convert annual sales, bottle sizes, shifts, changeovers and expected efficiency into a realistic filling-machine capacity instead of oversizing by guesswork.
Learn more
2026-08-03
PET Blow Molding Compressed Air Cost: A Practical Energy Audit
Find compressed-air waste in PET bottle production by measuring pressure, specific consumption, leakage, recovery and compressor loading by bottle SKU.
Learn more